DCF-Tool v1.2
About the project
What is the DCF tool?
The DCF tool values businesses with the discounted cash flow method. It combines historical financials with planning assumptions and calculates the present value of future cash flows.
The model keeps historical values, forecasts, WACC and sensitivity matrices separate, making the assumptions and their impact on value easier to follow.
Version 1.2 adds a Monte Carlo simulation, a bear/base/bull scenario manager, a dividend discount model and a peer-group comparison. The simulation shows the distribution of intrinsic values, while the other modules compare valuation approaches and assumptions.
Features
What can the tool do?
Valuation parameters, tax rates and company data can be entered in one place. Scenario controls apply to the whole workbook.
Historical balance-sheet and income-statement data are recorded separately and made available to the later calculations.
Revenue, margins and capital expenditure needs are forecast across the planning horizon.
The calculator derives the weighted average cost of capital from the cost of equity and debt using CAPM.
Free cash flow to the firm is discounted, and terminal value is calculated with the Gordon growth model.
The matrix shows how business value changes with different WACC and growth-rate assumptions.
Each recalculation runs 1,000 valuation simulations, showing percentiles, expected value and the probability that intrinsic value exceeds the market price.
Bear, base and bull cases can be compared directly. A quick switch and tornado chart show which value drivers matter most.
The two-stage DDM values dividend-heavy companies separately and compares the result with the DCF value.
Implied business value is compared with the peer group's EV/Sales, EV/EBITDA and EV/EBIT multiples. The result appears in a football-field chart.
Six KPI cards show price, intrinsic value, upside, WACC, the Monte Carlo median and the active scenario.
The worksheets use consistent structures and standard formulas without hidden macros. The formulas remain inspectable.
Screenshots
Einblicke ins Tool
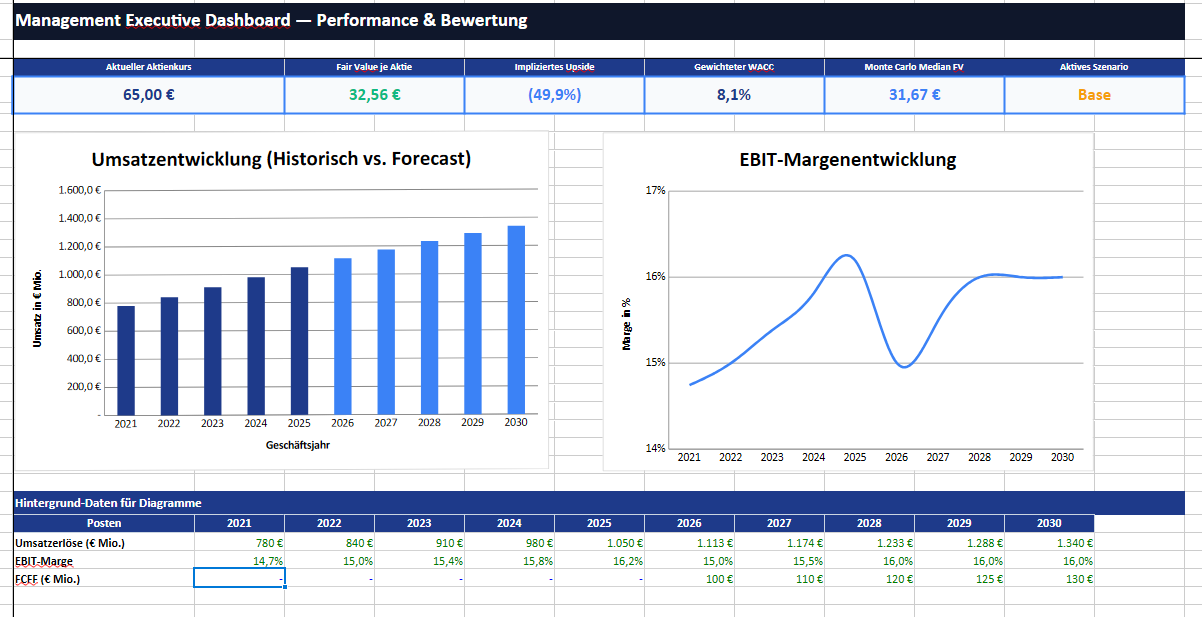
Finance dashboard
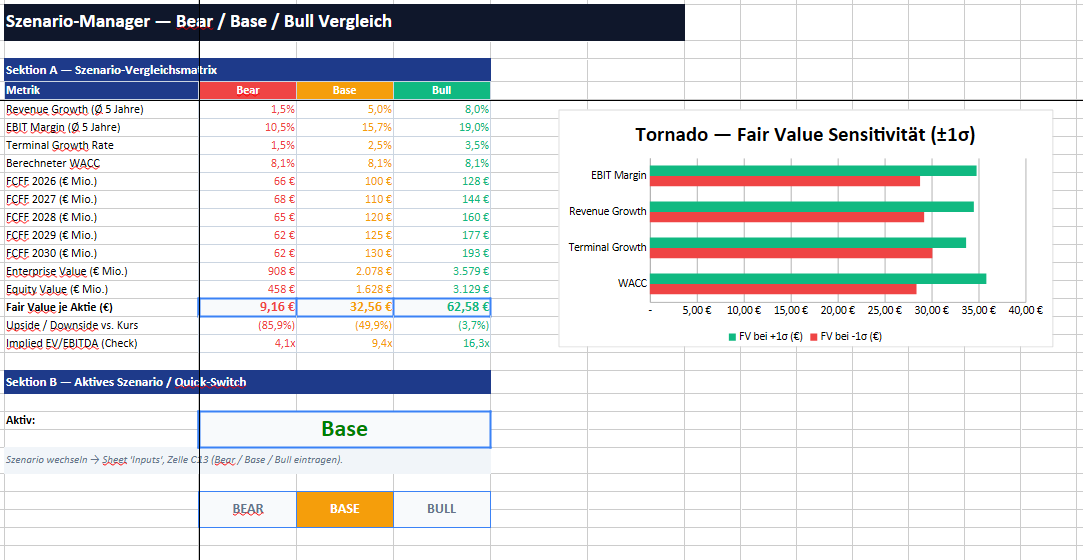
Financial-data inputs
Reflection
What I learned
I worked with WACC, cash-flow forecasts and wider corporate-finance concepts. The mathematical calculations had to remain usable in a clear Excel model without VBA.
Separating history from the forecast makes scenario analysis easier. It shows how strongly growth assumptions change business value.
For version 1.2, I implemented the Monte Carlo simulation with more than 1,000 formula rows and no VBA. The model also compares DCF, DDM and multiples so the results can be checked against each other.