Real-estate cost calculator
About the project
What is the real-estate cost calculator?
The workbook models a rental property in Excel. Financing, operating costs, taxes and the eventual sale all live in one file.
Cash flow, remaining debt, rent, inflation and the exit are projected for up to 30 years. Version 1.6 adds service charges, special assessments and renovations to the cash flow.
Technology: Microsoft Excel | Standard formulas | Dashboard | 30-year projection
Features
What the tool can do
- Property and investment data: Enter property details, purchase price, purchase costs and financing parameters, including an amortising loan.
- Total investment costs: Automatically calculate the full investment cost, including the required equity.
- Rent and operations: Model rental income, non-recoverable costs, reserves and ongoing operating expenses.
- Taxes and depreciation: Include depreciation, tax effects and the risk of rental income shortfalls.
- Key figures: Gross and net rental yield, levered XIRR, cash-on-cash, DSCR, NOI, cap rate, break-even rent, LTV and net sale proceeds. Negative values do not stay green; the traffic-light thresholds are documented in the model notes.
- 15% renovation warning: A green/yellow/red check tests whether renovation costs in the first three years exceed 15% of the building value. It also calculates the capitalisation requirement with reference to Section 6(1)(1a) of the German Income Tax Act.
- Scenarios: Worst, base and best cases (−15% / 0% / +10%) are compared across ten core variables. Results are split into four blocks covering deviations, absolute values, derived figures and final outcomes.
- Interest-rate test: Seven rates across a ±3% range show how the annuity, interest expense, cash flow, total interest burden and break-even rent change at each level.
- Exit analysis: Calculate speculation tax, capital gain, accumulated depreciation, remaining debt and net sale proceeds. The tax-free exit from year 10 is compared separately.
- Equity optimisation: Find the minimum equity for cash flow ≥ 0 in year 1 and sustainably without the immediate renovation deduction. A 10–50% equity table and a grid show the maximum purchase price for a target XIRR.
- Real-value analysis: A 30-year table shows nominal and real cash flows, rental income and remaining debt using an editable inflation rate (default: 2.5%). It also includes loss of purchasing power, real equity return and the break-even year.
- 30-year projection: Cash flow, principal repayments, interest and remaining debt are projected across several decades.
- Rent increases: The model supports indexed rent increases and long-term inflation assumptions.
- Design and structure: The layout uses navy blue, grid lines and a clear table structure.
- Technical setup: English Excel standard formulas are used without macros or external add-ons.
Screenshots
A look at the tool
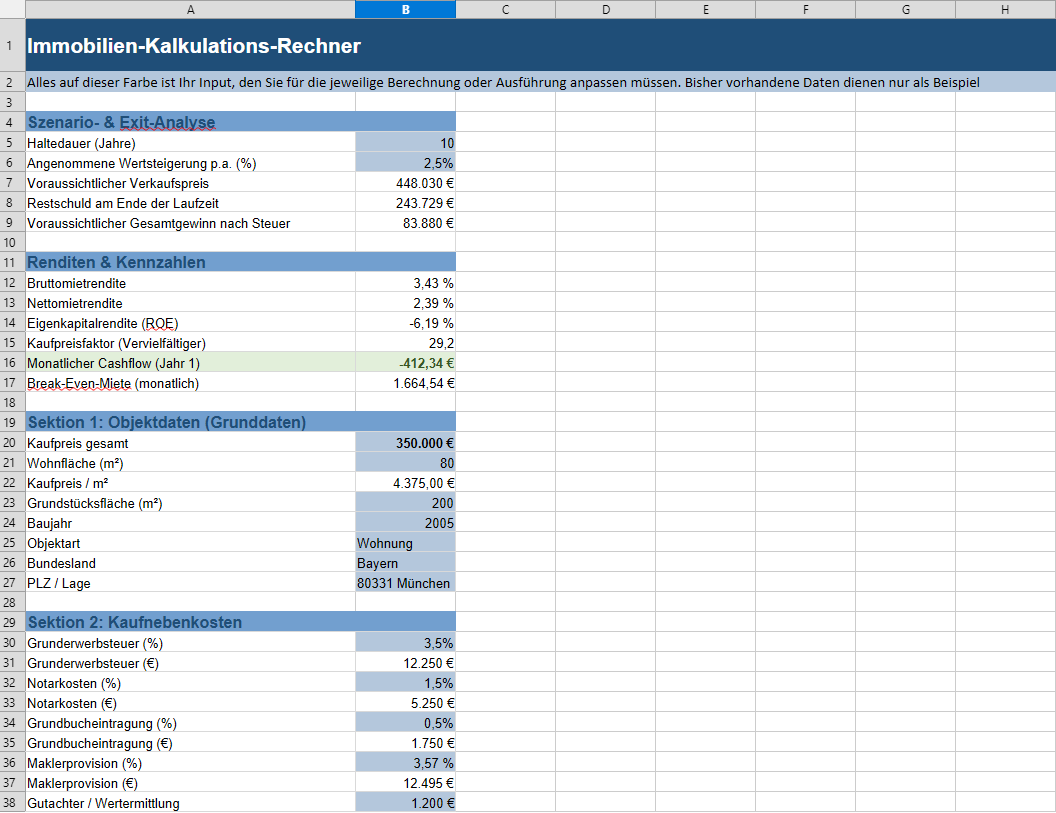
Dashboard
Looking back
What I learned
This project made me work through property valuation, financing models and long-term cash-flow analysis. The financial logic had to be implemented directly in Excel.
Complex calculations are only maintainable with a clear table structure. Inflation, rent increases, financing costs and taxes all had to fit together in one model.